
Process Technology · Resource Efficiency
How inline measurement data changes an industrial process: less water, less energy, fewer chemicals, lower emissions and higher efficiency. All of it measurable, all of it controllable.
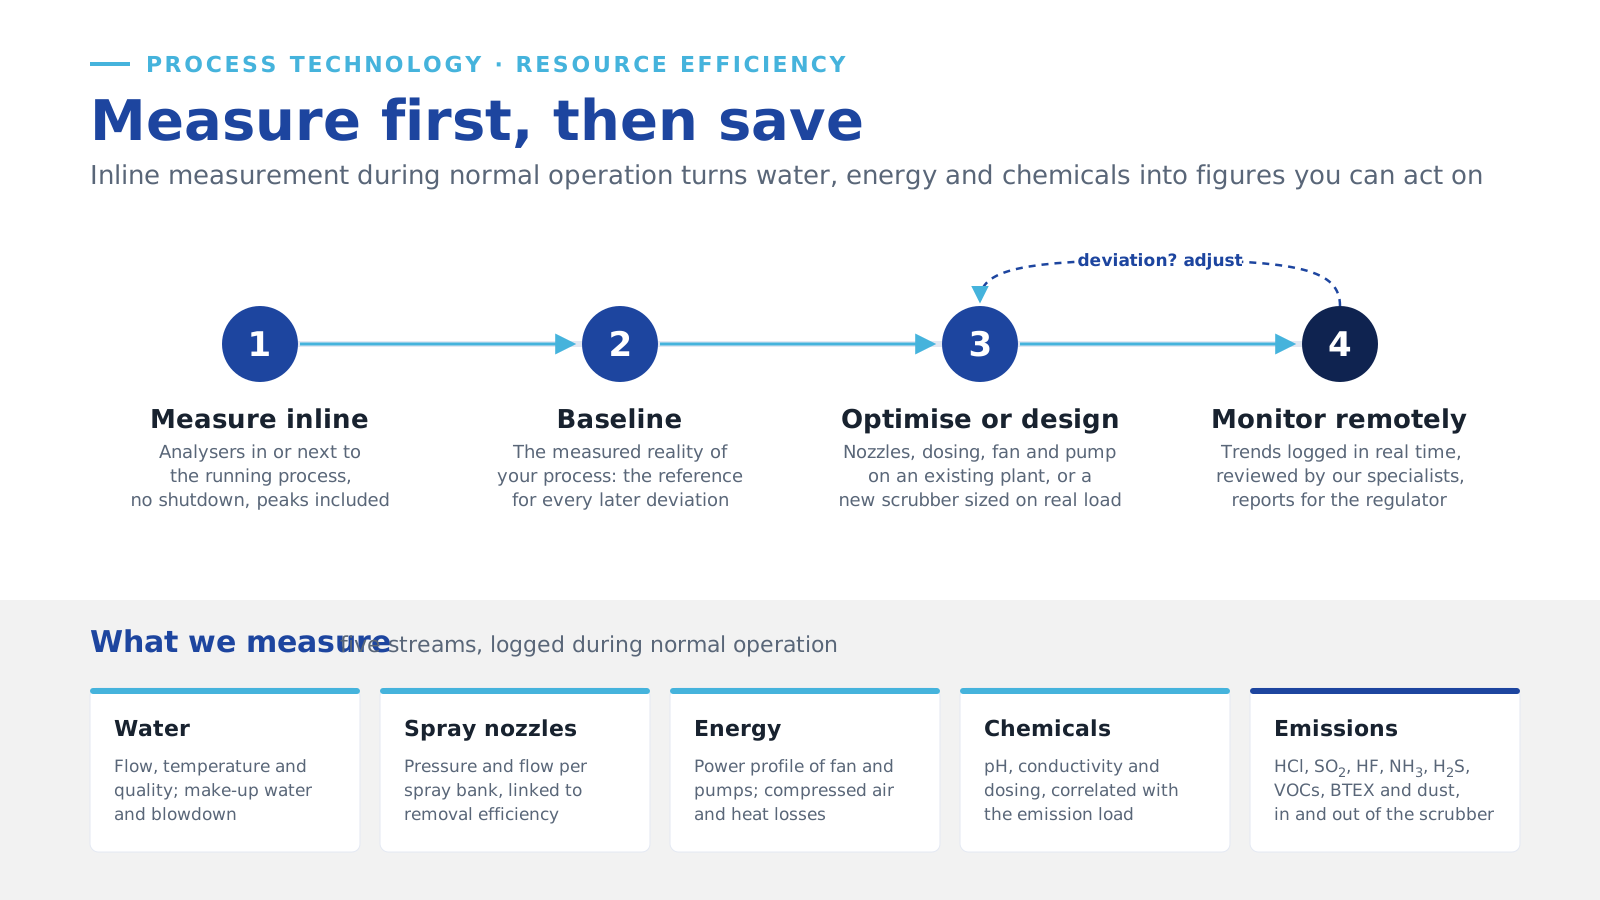
Many industrial companies know exactly what their installation costs, but not what it actually consumes. How much water passes through your wet gas scrubber? Are you dosing more chemicals than the process needs? Is your fan running at full power when half would do? And how much raw material or energy is lost while the process, to all appearances, is running normally?
Water, energy, chemicals, compressed air and heat are the silent cost items of every industrial process: invisible until you measure them. This article explains what Lechler measures inline, in or next to the running process and without a shutdown; how one initial measurement serves both the optimisation of an existing plant and the design of a new one; where the savings come from, with the spray nozzles as the lever most often overlooked; and how the data keeps working afterwards, for operations and for the regulator.
01 Resources you only see once you measure them
Resources such as water, energy, chemicals, compressed air and heat rarely appear as a line of their own on a cost report. They are spread over the water bill, the electricity bill and the chemicals budget, and nobody links them to how the gas cleaning is actually running. That makes them easy to overlook and hard to manage.
The answer lies in data: continuous, reliable and validated measurement data from your own process. We believe that decisions based on that data are the key to lasting resource savings. That is why Lechler works as a process partner rather than as a supplier of separate components: we think along, design along and share responsibility for the result. And it all starts with measuring.
02 Inline measurement: making resources visible
Lechler places its analysers fully inline: in or next to your running process, without a shutdown and without trials on paper. The analysers measure continuously and deliver real-time data on every relevant stream: water, energy, chemicals, emissions and process gas. That data is the basis for the saving advice and system changes we propose. No assumptions, but facts from your own installation.
- 1
- Water use and quality. Flow, temperature and quality of the scrubbing liquid, the make-up water and the blowdown, logged continuously. With that data we adjust the spray strategy so the same absorption is reached with less water.
- 2
- Nozzle performance. Pressure and liquid flow per spray bank, linked to the removal efficiency. At the measured pressure, the nozzle characteristic gives flow, spray angle and droplet size, so we can select and set the right Lechler nozzles for your process gas.
- 3
- Pump energy. Power profile of the recirculation pump under real operating conditions. A pump that delivers more flow or pressure than the nozzles need shows up in the data.
- 4
- Fan energy. Power profile of the fan. If it runs at full power when less will do, the data shows it, and we use it to cut kWh at the same cleaning performance.
- 5
- Chemicals. pH, conductivity and reagent dosing, tracked live. Set against the emission concentrations, they make overdosing visible, so the dosing strategy can be matched to the real load.
- 6
- Emissions. Acid gases (HCl, SO₂, HF), VOCs, BTEX, NH₃, H₂S and dust, recorded during operation. Relevant for the permit, and the outcome every other measurement is judged by.
Emission data is more than a permit matter. It is also a basis for process optimisation: lower emissions often mean that less product, solvent or raw material is lost to the stack. Beyond the scrubber itself, we also map the use of compressed air and heat. These hidden losses are regularly missed in traditional audits, yet they can add considerably to unnecessary operating costs.
During commissioning, our engineers record validated correlations between emission levels, process parameters and dosing rates. Together they form the baseline: the objective zero measurement against which every future deviation is measured.
03 Measure first, then optimise or design
Good decisions start with good data. Whether you want to optimise an existing installation or design a completely new one, without reliable measurements you are working on assumptions. We solve that with a targeted initial inline measurement, carried out during normal operation and without interrupting the process. That measurement serves two purposes.
Optimising an existing installation
Many companies do not know how their installation actually performs today. An inline measurement shows where losses occur, where water, energy or chemicals are wasted, and which changes give the best return. Not on the basis of design specifications from years ago, but on live data from your current process.
Designing a new installation
If you want a new wet gas scrubber or monitoring system but cannot supply process data, we carry out the measurements for you. Emission concentrations, gas composition, flow, temperature and peak loads become the technical basis for an installation that fits your process, rather than an oversized standard system.
Our engineers come to your site and connect the analysers directly to your process gas: at the stack, the scrubbing tower, the fan or the spray zone. The installation keeps running. The initial measurement covers:
| Measured | What it shows |
|---|---|
| Emission profile | O₂, H₂S, SO₂, HCl, NH₃, BTEX, VOCs and dust (PM) in your flue gas or process gas, measured during operation: which components are present, and at what concentrations. |
| Nozzles and water efficiency | Which nozzles are fitted, their operating pressure, flow and spray pattern, and how much water they use per unit of emission reduction. Shows directly whether a better nozzle selection or a different spray layout would save water. |
| Scrubber efficiency | Inlet and outlet concentrations compared live, without a shutdown. Tells us which changes or extensions are needed to reach the required efficiency. See Simultaneous Scrubber Testing with Analysers. |
| Fan and pump energy | Power profile under real operating conditions, so that energy optimisation rests on figures instead of assumptions. |
| Scrubbing liquid | pH, conductivity and consumption during production. Reveals overdosing or underperformance, and gives the input for setting the chemical dosing. |
| Peak loads and variation | Because the measurement is continuous, it also records the dynamics of your process. The solution is then designed to perform under the heaviest conditions, not just at the average. |
The result is a clear measurement report with baseline data: the measured reality of your process. For optimisation, it underpins targeted proposals for nozzle selection, dosing strategy, energy use or scrubber efficiency. For a new design, it is exactly the technical input needed to engineer an installation that matches your actual process conditions. What such a survey has to deliver to serve as a design basis is covered in Measuring an Unknown Emission.
Connect on site
Analysers are connected to the process gas, and power and flow are logged on fan, pumps and utilities. Production continues.
Measure during operation
Continuous logging over normal production, including start-ups, peaks and quiet periods.
Baseline report
The measured reality of your process, and the reference for every later comparison.
Optimise or design
Nozzle selection, dosing, fan and pump settings or targeted retrofits on an existing plant; or a new scrubber sized on the measured load.
Monitor
Trends logged and reviewed remotely, so that a deviation from the baseline is seen before it becomes a problem.
We do not stop at delivering an analyser or a scrubber. As a process partner, we stay involved from the first measurement to the lasting improvement of your process: from spray nozzle to clean air, with the resources it takes as part of the solution.
04 Saving starts with understanding
Without measurement data you optimise on instinct. With it, you optimise on facts.
Lower emissions
Continuous monitoring shows directly whether your scrubber is operating under the right conditions. A drop in the pH of the scrubbing liquid that you see earlier means less chance of emission peaks, and less risk of exceeding your permit limits.
Fewer chemicals
Knowing the relation between emission concentration and chemical dosing precisely prevents overdosing. That is where the savings on acids, caustic and other process chemicals come from.
Less energy
Unnecessary overpressure at the fan or a recirculation flow higher than the nozzles need raises your energy bill. Process data shows exactly where energy is lost, and how to address it.
Less water
Measuring pressure and flow per spray bank and linking them to the emission reduction achieved tells us how much water is really needed. More on that in the next section.
05 Spray nozzles as a data-driven saving tool
The Lechler nozzles in your scrubber are not just components: they are the heart of the scrubbing process. The Lechler Group makes spray nozzles and mist eliminators, and that expertise makes the difference in a data-driven approach. Where others stop at the emission measurement in the stack, we link the emission data directly to the behaviour of the nozzles inside the scrubber. That answers questions such as:
- Which spray nozzle gives the right droplet size for your process gas?
- How much liquid is really needed for the absorption you require?
- Can the spray pressure come down without losing removal efficiency?
These questions can only be answered with inline spray data, and the right answer leads directly to water savings without compromising the emission result. Many installations use more water than necessary because the nozzles are not matched to the current process gas. Real-time spray data makes it possible to match blowdown frequency, make-up water and nozzle configuration to the actual process load, and so save water for good without giving up scrubbing efficiency.
Pressure and flow per bank also show how nozzles age: wear drives the pressure down, plugging drives it up. How that works, and why it is the earliest warning on a spray scrubber, is explained in Meeting the Limit Is Not the Same as Proving It.
06 Optimising existing installations
Not every improvement starts with a new installation. Many companies already run a wet gas scrubber or a spray system, but do not know whether it still performs as it should. Lechler carries out inline measurements on existing installations to find out:
- Scrubber efficiency. Does the scrubbing tower still reach the required emission reduction? We measure it on your current process gas.
- Nozzle check. Are the current nozzles still suited to the process conditions? Inline flow and pressure measurements reveal wear, plugging and an operating point that has drifted from the design.
- Fan and pump energy profile. Is the installation running at the right capacity, or using electricity unnecessarily through excessive pressure or flow?
- Chemical consumption. Does the dosing still match the current emission load? Real-time correlation data shows directly whether you are overdosing.
From the data we write an optimisation report with concrete recommendations: a different nozzle selection, an adjusted dosing strategy, energy-saving settings or targeted retrofit measures. Not a hunch, but measured evidence as the starting point for improvement. The retrofit options themselves are set out in Upgrade or Replace?
07 Data that keeps working, also remotely
Lechler systems measure inline and log in real time. The data is available at any time through a secure remote platform. Our specialists review your process data remotely and step in as soon as trends deviate, without anyone needing to come to site. That means faster interventions, less unplanned downtime and lower maintenance costs.
After installation, you receive a periodic overview of emission trends, chemical consumption, energy profile and maintenance events. No surprises, but progress you can show. How the control system and remote access are set up is described under remote support.
08 Transparency towards regulators
Environmental agencies and permitting authorities increasingly ask for verifiable, continuous emission data. Our continuous emission monitoring systems (CEMS) deliver transparent reports that permit holders and competent authorities can use directly.
For your organisation, that means less administrative pressure, and more certainty that you meet the requirements of the Dutch Environment and Planning Act (Omgevingswet) and European emissions legislation.
09 What it delivers
The results customers see after introducing continuous monitoring and data-driven optimisation, on new and on existing installations:
- Demonstrable emission reduction, documented and verifiable, also for the competent authority.
- Lower water and chemical use, through data-driven nozzle control and dosing correlations.
- Lower energy costs, with fan and pumps running at the capacity that is actually needed.
- Better nozzle performance, with nozzles selected and set on the basis of the measured process gas.
- Better existing installations, without replacement, through measurement data and targeted retrofits.
- Less unplanned downtime, because trend data flags deterioration well before a failure.
- Complete compliance records, with permit reports straight from the data system.
- A design built on your data, not a standard solution but a system based on your actual process conditions.
Industrial companies have a right to know what their processes are doing. That insight is the basis for every step towards more sustainable, more efficient and compliant production, now and in the years ahead.
Curious what continuous measurement data could mean for your process? Tell us what you run and what you would like to save, and we will tell you what to measure and what the data can deliver. Contact us, or see analysers.nl for the analysers we use.
Frequently asked questions
Does an inline measurement require a shutdown?
No. The analysers are connected to the running process at existing or temporary sampling points, and production continues. That is the point of it: the data shows the process as it really runs, including peaks and variation.
We have no process data. Can you still design a scrubber for us?
Yes. In that case the initial measurement provides the design basis: gas composition, concentrations, flow, temperature and peak loads. The scrubber is then sized on the measured load instead of on an assumption.
Does continuous monitoring replace the periodic stack measurement in my permit?
Not by itself: what is required is set by your permit and the competent authority. Continuous data covers the hours between two statutory measurements, shows the cause of a deviation, and gives you a documented record when questions arise.
Where do the savings usually come from?
That differs per installation, which is why we measure first. Typical candidates are nozzles that no longer match the process gas, dosing that follows a fixed setting instead of the load, and a fan or pump that runs at more capacity than the process needs.
't Woud 59, 3232 LN Brielle, The Netherlands · +31 181 419 419
Inline measurement, spray nozzle selection and open spray scrubbers, from the first measurement to verified savings. Part of the Lechler Group.